
Microsoft's PowerPivot ushers in self-service BI
Could the age of self-service BI (business intelligence) finally be near? And, if so, are organizations ready?
For years, BI vendors have promised a way for managers to easily build their own reports from scratch, without the help of IT staff. Now, with the release of Microsoft Office 2010, managers are finding they can do these tasks using a powerful new Excel feature, called PowerPivot. And, by its ease of availability if nothing else, this feature is promising to shake up the field of BI.
"It will spread like wildfire. As organizations upgrade to Office 2010, Excel users will adopt PowerPivot, whether the [IT staff] likes it or not," said Gartner analyst Rita Sallam.
And thus far BI professionals seem ambivalent about PowerPivot. At a packed PowerPivot birds-of-a-feather session at the Microsoft TechEd conference last June, many admitted that the feature is powerful, even as they worried about the repercussions of its use within their own offices.
"Some of our concerns [are around] letting users loose, the size of the files that they want to share and the kind of data they want to share," one attendee said.
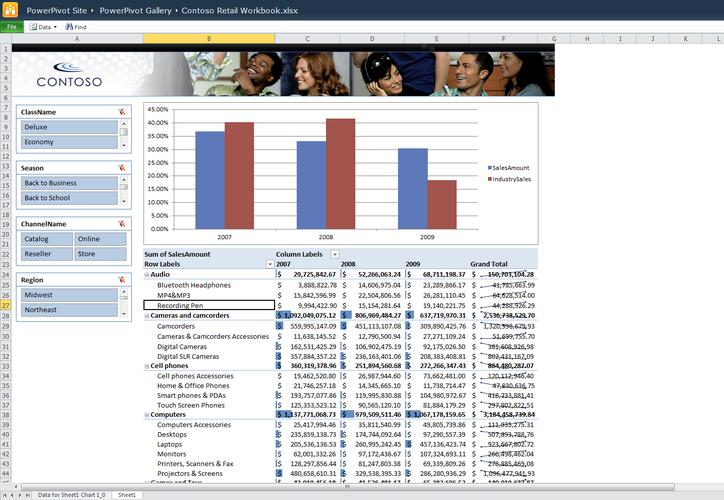
As the name implies, PowerPivot is a PivotTable on steroids. With PowerPivot, you can pull into Excel large amounts of data from multiple database tables, databases or other sources of data, and sort and filter them almost instantly. Data can be reorganized around one column or compared against columns from another data source. You can divide the data by time, geographic origin or some other parameter. Since it runs Microsoft's business intelligence software on the back end, it can do much of what a full-fledged BI application can do.
And PowerPivot can work blazingly fast too. Architecturally speaking, it replicates the technology found in many in-memory databases, allowing users to sort millions of rows of data within a few seconds.
The best part about PowerPivot is that it is free, or at least it is a free feature of Microsoft Office 2010 (though to really enjoy its full power, an organization should also run Microsoft's SQL Server on the back end). This means that all the power Excel users in your organizations will start playing with it sooner or later.
But a potential danger lurks in this ease of use, said Andrew Brust, the chief technology officer for Microsoft integrator Tallan. (Brust also moderated the PowerPivot TechEd session.) Promiscuous use of PowerPivot may only aggravate a problem that has already become an issue for many data-centric organizations over the past decade, one that came about in large part due to the managerial popularity of Excel.
Organizations have spent considerable money and effort establishing data warehouses, cleansing their data in order to have what is commonly known as "one version of the truth." The problem with most BI shops, however, is that they can only produce a fraction of the reports needed by managers, said Rob Collie, chief technology officer for the BI consulting and service firm PivotStream. So many users studied up on Excel and learned how to produce ad-hoc reports on their own, often colloquially called spreadmarts.
"There are a lot of people who are doing BI, but they just are not calling it that. They are doing a lot of their work in Excel and are not using mainstream BI technologies," Brust said. "And they are doing it totally off-road, so IT doesn't know about it."
Thanks to their creativity, the reports they create often use out-of-date or incorrect data. The resulting reports can be passed around the office and taken as gospel.
Worse, because they are in Excel, the reports being passed around often contain closely held company business practices, in the form of cell calculations, Collie noted.
Now, PowerPivot, with its ability to easily make reports of even greater depth, will only further muddy the waters of organizational insight, many fear. "Business users can combine data in a way that may not be compliant with corporate data sources or metrics," Gartner's Sallam said.
Nonetheless, if the organization puts a few rules and technologies in place, PowerPivot could actually diminish the proliferation of such spreadmarts.
One tip: Managers can publish their PowerPivot reports to a SharePoint repository, where they can be viewed by others, suggested Herain Oberoi, Microsoft director of product management for the company's SQL Server Business Group. There, the reports can be automatically updated as data changes -- eliminating the problem of out-of-date reports floating around. The SharePoint reports also do not contain the calculations used to generate the numbers.
This approach also allows the IT staff to keep track of what reports are the most popular, Oberoi said. The staff can then polish these reports and turn them into official, companywide summaries.
Another good habit the IT staff should get into as PowerPivot gets deployed: Maintain a repository of sanctioned data sources and metrics, Sallam advised. In this way, organizations can allow the data mashups, as long as the source data itself has been vetted and cleansed.
To some extent, PowerPivot may have BI professionals worried because it may put them out of a job. This probably won't happen though.
Even though PowerPivot offers some BI capabilities, it should never replace a full-fledged BI platform, analysts say. Even as an ad-hoc reporting mechanism, PowerPivot doesn't have as wide a range of features as other standalone, self-service BI offerings, such as Tibco Spotfire, Sallam notes. PowerPivot should be strictly used for informal reporting needs, she advises. For formal reporting, organizations insistent on staying with the Microsoft stack should use the company's SQL Server Reporting Services and SQL Server Analysis Services.
Also keep in mind that PowerPivot may not rectify most data quality issues, such as deduplication or data lineage issues. Nor does it work easily with advanced modeling issues, such as dealing with nonconforming dimensions, slowly changing dimensions or multiple hierarchies, noted James Dixon, the chief technologist for BI software provider Pentaho.
"You need to make sure you have 100 percent agreement on the keys in the different datasets, and you need to be very careful how the join is done, otherwise the resulting data is meaningless. This is particularly hard with datasets that have differing levels of granularity," he said, adding that these problems are solved using ETL (Extract, Transform and Load) tools.
"These tools are not out of reach for a seasoned Excel user to understand, but factoring in the data quality has to be done -- even the flashiest analysis of bad data is going to lead you to make wrong decisions," Dixon said.
Joab Jackson covers enterprise software and general technology breaking news for The IDG News Service. Follow Joab on Twitter at @Joab_Jackson. Joab's e-mail address is Joab_Jackson@idg.com
Join the CIO Australia group on LinkedIn. The group is open to CIOs, IT Directors, COOs, CTOs and senior IT managers.