

From simple to complex models – how do you find the sweet spot on that spectrum? This is a question that Daniel Marlay, director of Ernst and Young’s Actuarial practice, addressed at a recent Data Science meetup in Sydney.
“For classes of models and even across models, there’s generally this idea of model complexity. The more complex a model is, the better we can fit features in the data. A more complex model is able to have more of the wiggly bits that allow us to hit the data exactly, whereas a simpler model doesn’t have those wiggly bits. And so we end up with a trade-off,” said Marlay, pointing out the bias-variance trade-off challenge in predictive modelling.
The challenge is that a simpler model has the flexibility to better predict with new data that comes in but tends to have high bias, in that it doesn’t represent the training data as accurately. More complex models, on the other hand, fit the training data more accurately but tend to overfit where they perform badly with new data.
To help address this, Marlay discussed some common techniques for assessing the ‘goodness of fit’ for models – or how well the observed values match the expected values – and how to compare and evaluate models using simple linear regression and multiple linear regression.
Simple linear regression predicts a numeric outcome or response using one predictor or variable, fitting to a straight line. Multiple linear regression, however, is adding more than one predictor variable to predict a numeric response. In the below examples, complexity is increased by the number of predictor variables.
R-squared
This standard 'goodness of fit' measure is known as the ‘coefficient of determination’, and is calculated as one minus sum of squared residuals over the total sum of squares. It looks at how closely the data fits to the regression line, with a high r-squared meaning the model better fits the data – r-squared falls between 0 (low) and 1 (high).
This measure tends to favour more complex models, Marlay said, with more predictor variables usually resulting in a higher r-squared.
“One of the things we find with r-squared is that it doesn’t actually penalise you for overfitting. You can crank the model up as far as you want.
“And if you are not splitting into test and training, so if you are only looking at the training dataset when using r-squared, what you’ll find is it’ll drive you towards wanting to use the model with the most parameters,” he said.
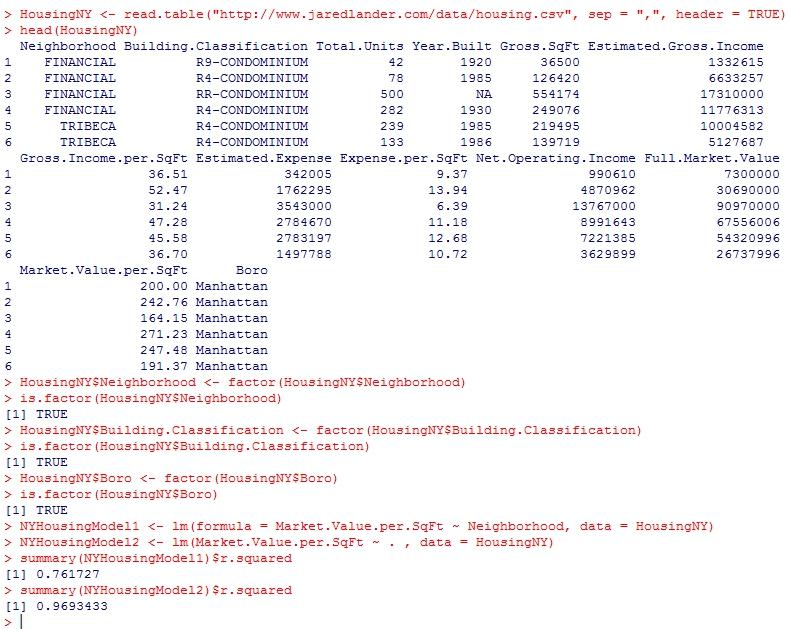
In the example below, a simple linear regression model with one predictor achieved a r-squared of 0.76, whereas a multiple linear regression that throws in all predictors achieved a r-squared of about 0.96.
Akaike Information Criterion
AIC is almost the opposite of r-squared in that it penalises more predictors. It measures the quality of a model in relation to another, and takes into account how flexible and general a model is – i.e. it tends to favour simplicity.
The lower the AIC value, the better the model as it will most likely prevent any overfitting and can work with only a few predictors to best explain the data. Also, it can be used to compare unrelated models and not just nested ones.
“Every time we add an additional parameter to improve the fit of the model, it's giving us a penalty to compensate for the fact that we are more likely overfitting the training data when we are doing that,” Marlay said.
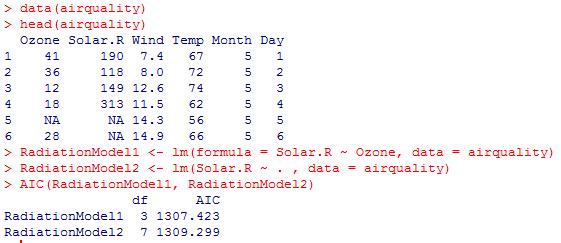
The below example shows a lower AIC for the model with only one predictor, whereas the other model using all predictors has a slightly higher AIC.
F-test/ANOVA
This helps determine whether adding extra predictors will make a noticeable difference in how the model will perform or not.
“Typically it’s formulated as does the model that we are fitting is it significantly different from another model,” Marlay explained.
In R, the ‘anova’ function carries out an F-test, where if the p-value shown in the results is greater than the significance level (usually set at 0.05), the null hypothesis of one model not being noticeably different to another is accepted – ie. concluding that there is no significant difference between the models. If the p-value is equal to or less than the significance level of 0.05, then the null hypothesis is rejected.
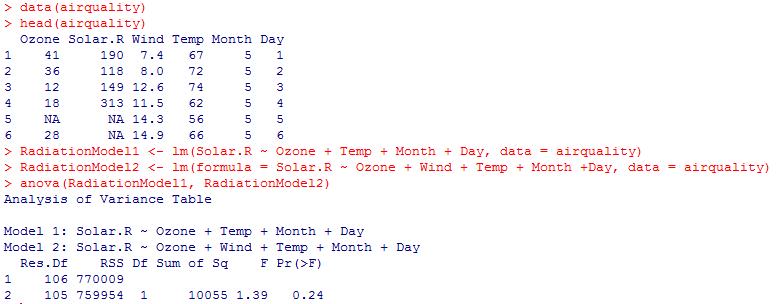
The below example shows a p-value of 0.24, meaning the model using five predictors is not noticeably better than the other model, which uses four predictors.
Cross validation
k-fold cross validation is an evaluation method that rigorously tests a model. Marlay said this method can be particularly useful for smaller datasets (say less than 100 rows), as it ensures that the model maximises its use of the data.
The basic idea is that an entire dataset is split into k subsets, and trained and tested in k folds (k being any number, usually 10). One of the subsets is used for testing and the others are used for training the model. After having tested once, it goes through the same processes again but this time with a different subset as the test set. It continues to do this until it reaches k times.
“As we go through that, we are estimating how does the generalised error of the model, so the held out data, how does that vary as a function of my tuning parameter. So what cross validation allows us to do is go through and work out how complex should the model be,” Marlay explained.
Below is an example of 10-fold cross validation applied to a dataset with 88 rows, with each fold's mean error.

CIO used its own examples in R to accompany the article.
Join the CIO Australia group on LinkedIn. The group is open to CIOs, IT Directors, COOs, CTOs and senior IT managers.