What animated movies can teach you about data analysis
- 26 February, 2014 14:37
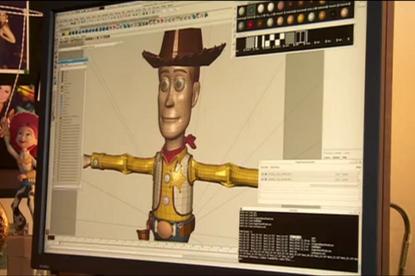
A 3D rending tool being used to create a character for the animated movie Toy Story
There’s not much use in presenting data through convoluted, cluttered-looking reports that could make a person instantly fall asleep. That’s the view of Pat Hanrahan, who has spent most of his life working on data visualisations and beautiful images.
Hanrahan’s interest in data visualisations was spurred on by his experience working for Pixar during the early years from 1986, when Steve Jobs headed the company. He was chief architect of Pixar’s RenderMan software, an application programming interface or algorithms that create images from 3D arrays.
He made his mark with this software through movies such as Toy Story in 1995, which was the first animated feature film fully created with 3D computer graphics.
This software earned Hanrahan, and his team, an Oscar award in 1993. He also won an Oscar in 2004 for simulating translucent and realistic-looking skin for the character Gollum in The Lord of the Rings, and another one this year for realistic-looking lighting in films like Avatar.
In 2003, Hanrahan co-founded the company Tableau, a tool that helps low-level skilled people turn data into insights through data visualisations. He also co-founded multicore programming startup PeakStream in 2005.
One of Tableau’s co-founders, Chris Stolte, who was a student of Hanrahan at Standford University, developed the underpinning technology, Polaris (VizQL), that turns database queries into visual representations such as maps and graphs.
“I was getting a little tired of entertainment and working in the movies. I developed all this graphics technology and… I wanted to find a use for it that’s more work-related or business-related. So I became interested in data visualisation [and thought] we could we put it in the hands of ordinary people to help them solve important problems,” Hanrahan said.
“We were outsiders to the field, we were graphics people. So we thought about movies, beautiful pictures, easy interaction and responsiveness. The world has become more visually rich. It’s a natural interface for presenting information to people.”
Some of the first users of Tableau include Google, Facebook, Apple, Amazon and Zinga. The Commonwealth Bank of Australia and the Sydney Morning Herald are also users of Tableau.
Google uses Tableau to drive efficiencies in its data centres and monitor things like what percentage of its servers are being used, where the traffic is coming from, whether Google images or news is driving majority of traffic, etc, Hanrahan said.
Zinga uses the data visualisation software to monitor gamers’ strategies to help redesign their games and make them more stimulating, Hanrahan said.
Besides the big tech companies, Hanrahan said the software is also being used in the health and education industries.
“Seatlle Childrens Hospital is one and the surgeons use Tableau to monitor what happens after their surgeries. So they’ll do a surgery and they might find that with one surgeon half their patients have to be readmitted to the hospital within the next week. So the surgeon is probably doing something wrong,” he said.
“Another one of our customers is a school district where they have the highest dropout rate in the country [United States] and they can’t figure out what they are doing wrong.
“So now they are using data to analyse what the kids are doing, when they are missing their homework to get a sense and predict when somebody’s having trouble so they can intervene in some way.”
Hanrahan said his mission is to make data visualisation accessible to the business users, not a tool specifically designed for IT professionals.
With a short supply of talent needed to carry out data analytics and big data initiatives, the idea is to have people who do not have high-level technical skills be able to create high-level insights.
CommBank, for example, is using Tableau for this very reason. Hanrahan said the bank was already using a lot of business intelligence tools, but the problem was that nearly all of the business units became heavily dependent on IT’s ability to utilise the technology and produce reports.
The amount of reporting became a burden on IT, which often meant business users weren’t getting the information they needed in a timely manner.
“Going back to the movies at Pixar, there was a bunch of tools that the animators would use and they would have to go to school to learn how to use programs like Maya and Autodesk. But there were very few [people who could do that] and they had to spend several years training in order to get to where they are,” Hanrahan said.
“I think the real win with technology is when you make ubiquitous so that everybody can use it. I’ve always been fascinated by taking the technology and making it more accessible to people.
“History will probably never remember Tableau because people will just assume that anybody can do data analysis and it’ll be ubiquitous, and we all will be interacting with data on our devices of the future and it’ll just seem obvious.”
But it’s not all about the tools and technologies, Hanrahan said. “I think people underestimate the importance of people. There are a lot of technologies, but I still believe the people part is the biggest challenge.”
He used the example of IBM’s supercomputer, Watson, and how it has “had a lot of trouble in the marketplace because it’s is one thing to play jeopardy well, it’s another thing to be an assistant to a doctor.” He said it’s important not to exclude people out of the decision-making process, especially when it comes to ethics and humanity.
“I don’t think that’s going to replace people. The complex decisions that people make… are not going to be turned over to machines.”
One of the biggest issues that Hanrahan has seen in the data analysis professions is the lack of appreciation of art and design.
“One thing about Steve Jobs, which I liked at Pixar, is he really made clear that making movies was important for our culture. Even to this today…people come up to me and say ‘my kids love Toy Story’ but he knew that instantly and how important that was. And so these art forms that we have are really important and we don’t want to lose them,” Hanrahan said.
“Even if you are in science and engineering, you need creativity, you need to appreciate design. Even when you are doing analysis, I think there’s a certain art and science aspect to it. You have to be very observant. Artists are very observant, and I like artists because they see stuff I don’t see.”
Limiting people’s access to data in the business is also another big issue, Hanrahan said. The people who deal with real business problems such as customer churn are the ones who need greater access to data, he said.
“The most common mistake is to think only a few people should have access to the data. They want to protect, [limit] access to it, over-constrain what you want to do with it. You want to respect privacy, and you don’t want data to be available when it should not be available. But that doesn’t mean you can’t give access to the right people.
“The people who have the real problems are the best ones to make the decisions. But if they can’t get access to the information they need then your company is going to suffer,” he said.